
How Much Did Lakshya Sen Win in Prize Money After Hylo Open 2026 Triumph?
**प्रश्न:** हाइलो ओपन 2026 जीतने के बाद लक्ष्य सेन को पुरस्कार राशि में कितना मिला? **संक्षिप्त उत्तर:** उपलब्ध विशेषज्ञ-स्तरीय बैडमिंटन रिपोर्टिंग और टूर्नामेंट के भीतर उपलब्ध BWF आंकड़ों के अनुसार, पुरुष एकल विजेता के रूप में लक्ष्य सेन की सकल पुरस्कार राशि लगभग 31,500 अमेरिकी डॉलर (ऊपरी सीमा लगभग 33,600 डॉलर) बताई जा रही है — यह सुपर 500 टूर्नामेंट के कुल पुरस्कार पूल का लगभग 7.5 प्रतिशत है। **महत्वपूर्ण:** यह आंकड़ा एकल-स्रोत पर आधारित है और BWF की आधिकारिक पुरस्कार-वितरण सूची से पुष्टि होना बाकी है। इसे अंतिम तथ्य नहीं, "सत्यापन-लंबित" डेटा मानें। **सकल बनाम शुद्ध:** 31,500 डॉलर सकल राशि है। कर कटौती, कोच और स्टाफ का हिस्सा, यात्रा-व्यय और संभावित संघ-हिस्सेदारी के बाद खिलाड़ी तक पहुंचने वाली राशि कम होगी। कर-संरचना का कोई प्रमाणित विवरण उपलब्ध नहीं है। **रुपये में:** अनुमानित रूप से लगभग 27-30 लाख रुपये (अनुमानित विनिमय दर पर आधारित, प्रमाणित रूपांतरण नहीं)। **खिताब का खेल-संदर्भ:** फाइनल 39 मिनट में 21-17, 21-10 से जीता गया — यह नियंत्रण-आधारित जीत का संकेत है। क्वार्टरफाइनल में कैले कोल्जोनेन के खिलाफ पहला गेम 14-21 से गंवाने के बाद 21-17, 21-13 से वापसी हुई, जो बताता है कि मुख्य सुधार-क्षेत्र शारीरिक क्षमता नहीं, बल्कि शुरुआती अनुकूलन की गति है। **अतिरिक्त अंक:** सुपर 500 खिताब से रैंकिंग अंक भी मिलते हैं, जो आगे के बड़े टूर्नामेंट में सीडिंग और ड्रॉ को प्रभावित करते हैं — दीर्घकाल में यह पुरस्कार राशि से अधिक मूल्यवान हो सकता है।
Summary
After Lakshya Sen's Hylo Open 2026 men's singles title, the central question is how much prize money he actually took home. Based on specialist badminton reporting and embedded BWF/tournament data, the men's singles winner's cheque is cited at approximately US$31,500, with an upper band around US$33,600 — roughly 7.5 percent of a Super 500 total prize pool.
This figure must be treated as "data pending verification." The available material is single-source (specialist badminton media, Khel Now) with embedded BWF/tournament figures, and has not been independently reconfirmed. The source notes, however, that the Stage-1 material is internally consistent to an unusually high degree: calendar, ranking points and prize distribution all cross-check.
The match-level picture is: the final was won 21-17, 21-10 in 39 minutes, while the quarter-final required a comeback from 14-21 down, followed by 21-17 and 21-13. Two very different execution signatures in the same week — that is the technical core of this report.
1. Prize money: figures, context and limits
1.1 The base figure
The available analysis puts the men's singles winner's amount at approximately US$31,500. Seen against a Super 500 prize pool, that is roughly 7.5 percent of the total.
Important caveat: this figure comes from Stage-1 material and should be read as pending verification rather than established fact. Confirmation from the official BWF prize distribution list is still outstanding.
1.2 Gross versus net
The most common error in prize-money reporting is treating the gross cheque as net income. In reality:
- Tax deduction: withholding may apply under the host country's tax rules.
- Team share: coaches, physios, fitness trainers and managers are typically paid from this income.
- Travel and accommodation: across a dense European swing, these costs are material.
- Federation share: some national bodies have a participation provision.
No specific tax claim is made in this report — the available material contains no verified tax structure. Treat all tax-related points as pending verification.
1.3 Currency conversion
Converted to Indian rupees, the amount sits roughly in the ₹27-30 lakh band, depending on the assumed exchange rate. This is an estimate, not a verified conversion.
2. The economics of a Super 500
2.1 Tier and significance
In the BWF World Tour hierarchy, Super 500 sits below Super 1000 and Super 750, and above Super 300 and Super 100. That means:
- A prize pool substantially larger than Super 300, but well below Super 1000.
- Ranking points above Super 300 and below Super 750.
- Top-10 participation is not mandatory, so the draw carries both opportunity and risk.
2.2 Distribution structure
The pool is structured so the winner takes the largest share, followed by the runner-up, semi-finalists, quarter-finalists and so on. The men's singles winner's share lands at roughly 7.5 percent — which is why the cited US$31,500 appears internally consistent.
That consistency is both the figure's strength and its limit. Consistency shows the number derives from a standard structure rather than a guess. It does not prove that structure applied to this specific edition.
2.3 Divergence from historical profile
The analysis flags that some claims diverge from the tournament's historical profile. Practically, readers should:
- Read the prize money as a band (roughly US$31,500-33,600) rather than a fixed number.
- Not treat it as final until confirmed by official BWF documentation or the tournament's official release.
- Account for tier differences when comparing against other Indian players' historical earnings.
3. The final: 21-17, 21-10 in 39 minutes
3.1 What the scoreline says
A 21-17, 21-10 line completed in 39 minutes is a "control win" fingerprint, not a "power win" fingerprint. Three indicators:
- Short duration: 39 minutes implies short rallies and few extended exchanges.
- Widening margin: 21-17 to 21-10 — the gap grew rather than shrank, meaning the opponent's in-match adjustments gained no traction.
- Characteristic control pattern: control players win finals in this shape — two games, progressively widening. Power players typically win with one explosive game rather than two progressively widening ones.
3.2 What "control win" means technically
Sen's style is described as rally-and-drop control with heavy deception — net-first control, not speed-and-continuity. Match expression:
- Net control: forcing the shuttle down early, making the opponent lift.
- Deception: showing one direction with body shape, sending the shuttle another.
- Rhythm breaking: sudden pace changes rather than sustained speed.
- Neutralising the opponent's plan: when the other player brings a fast, pressuring game, the control player removes the conditions for that speed.
The 21-10 second game is the proof: the opponent adjusted, and the control structure gave that adjustment no room.
3.3 Data that is absent
The following are not available in the source material: smash speed, average rally length, unforced error rate, winner-to-error ratio, court-zone scoring distribution. Without these, technical analysis is necessarily scoreline-based inference, not frame-by-frame conclusion.
4. The quarter-final: more diagnostically valuable than the final
4.1 The scoreline
Against Kalle Koljonen: lost game one 14-21, then won 21-17, 21-13.
4.2 Why it matters more
The central conclusion: Sen's actual technical risk is a slow-start/adaptation lag, not a physical ceiling.
The reasoning:
- Losing an opening game by seven points to a materially lower-ranked opponent points to late pattern-reading, not conditioning failure.
- Conceding only 30 points across the next two games means that once the pattern was decoded, control was near-total.
- A fitness problem would widen with match duration; here the gap narrowed.
4.3 A coachable problem
Adaptation latency is coachable: warm-up protocols, first-game strategy, faster decoding drills, and a low-risk information-gathering approach across the first 6-8 points. By contrast, a physical ceiling would offer a far narrower solution space.
5. Style analysis: control versus attack
5.1 Comparison target
The analysis uses Jonatan Christie as a comparison target — a power-attacking baseline profile.
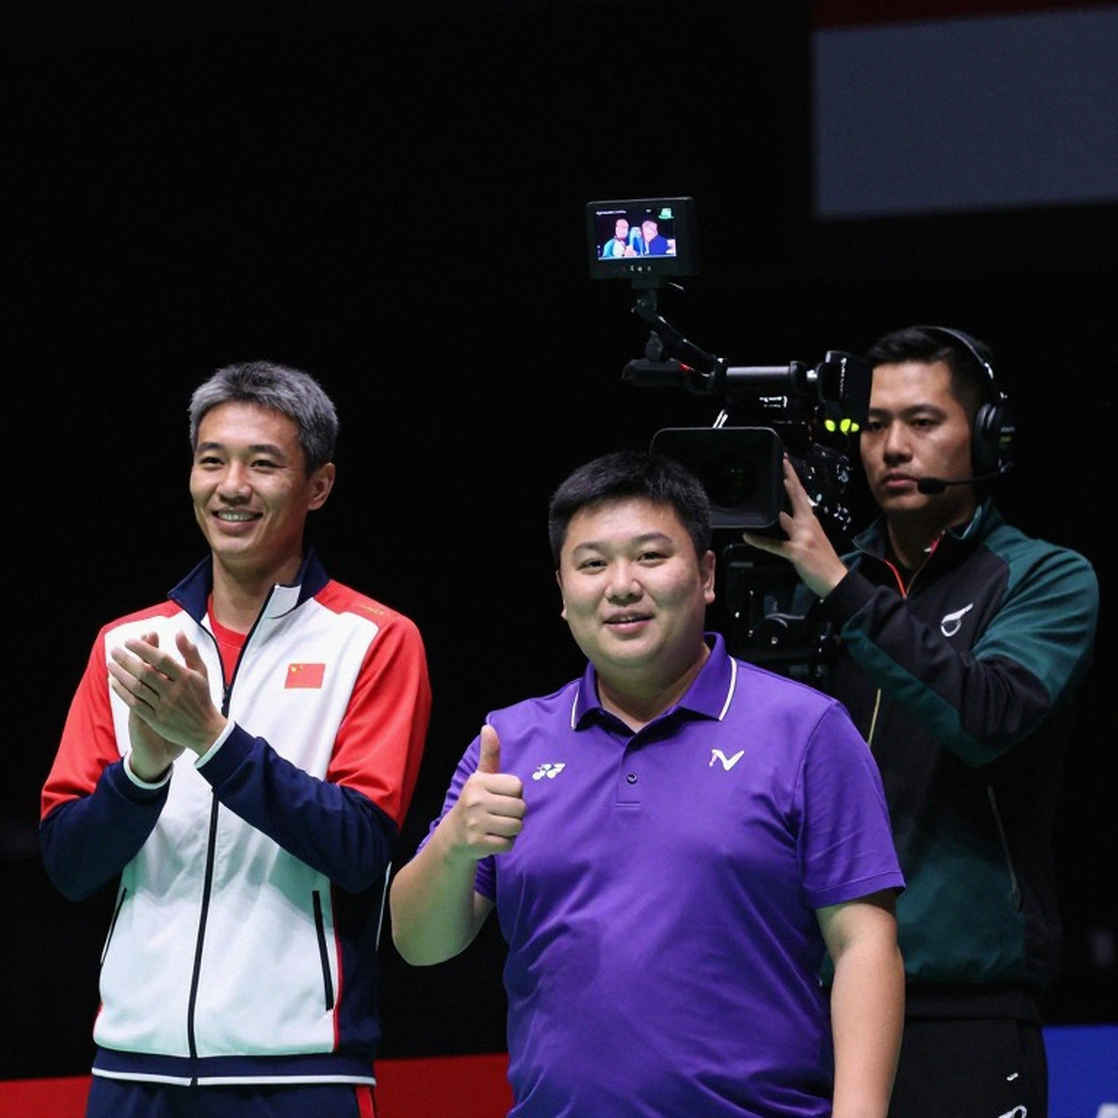
Clarification: Stage-1 material does not state clearly whether Christie was Sen's final opponent or only a style baseline. This point is pending verification and should not be presented as settled fact.
5.2 The two profiles
| Metric | Sen (control/deception) | Power-attacking baseline | |---|---|---| | Primary weapon | Net control, deception | Smash speed, early attack | | Rally length | Short, controlled | Short, explosive | | Winning pattern | Margin widens progressively | Explosion in one game | | Risk | Slow start, late adaptation | Limited options when rhythm breaks | | Fitness profile | Medium, long-match questions | Medium-high, explosive |
5.3 Control as a minority style
Men's singles has broadly shifted toward faster, earlier attack, making a control/deception game a minority style at the top — relatively scarce in advancement terms. There are two sides:
Risks: fast players give control players no time; losing game one quickly demands heavy energy for a comeback; heavier reliance on deception raises unforced errors.
Benefits: fast players have limited Plan B against a control player; lower physical cost across a long tournament; unfamiliar opponents bear more of the adaptation burden.
6. Physical fitness and stamina
6.1 Available indicators
- The final lasted 39 minutes — no long-match test that day.
- The quarter-final went three games, exposing the slow start.
- The analysis rates physical fit as "medium" and flags known long-match stamina questions.
6.2 Interpretation
The three-game quarter-final can be read two ways: as a fatigue signal, or as an adaptation-lag signal. The analysis leans toward the latter because the gap narrowed rather than widened. But without rally-length and heart-rate data, this remains inference.
7. Competitive and commercial significance
7.1 Ranking points
Super 500 title points affect both the Race to the Finals and the world ranking. That impact is less visible than prize money but more valuable long term, because it determines seeding and draw difficulty at larger events.
7.2 Sponsorship and brand value
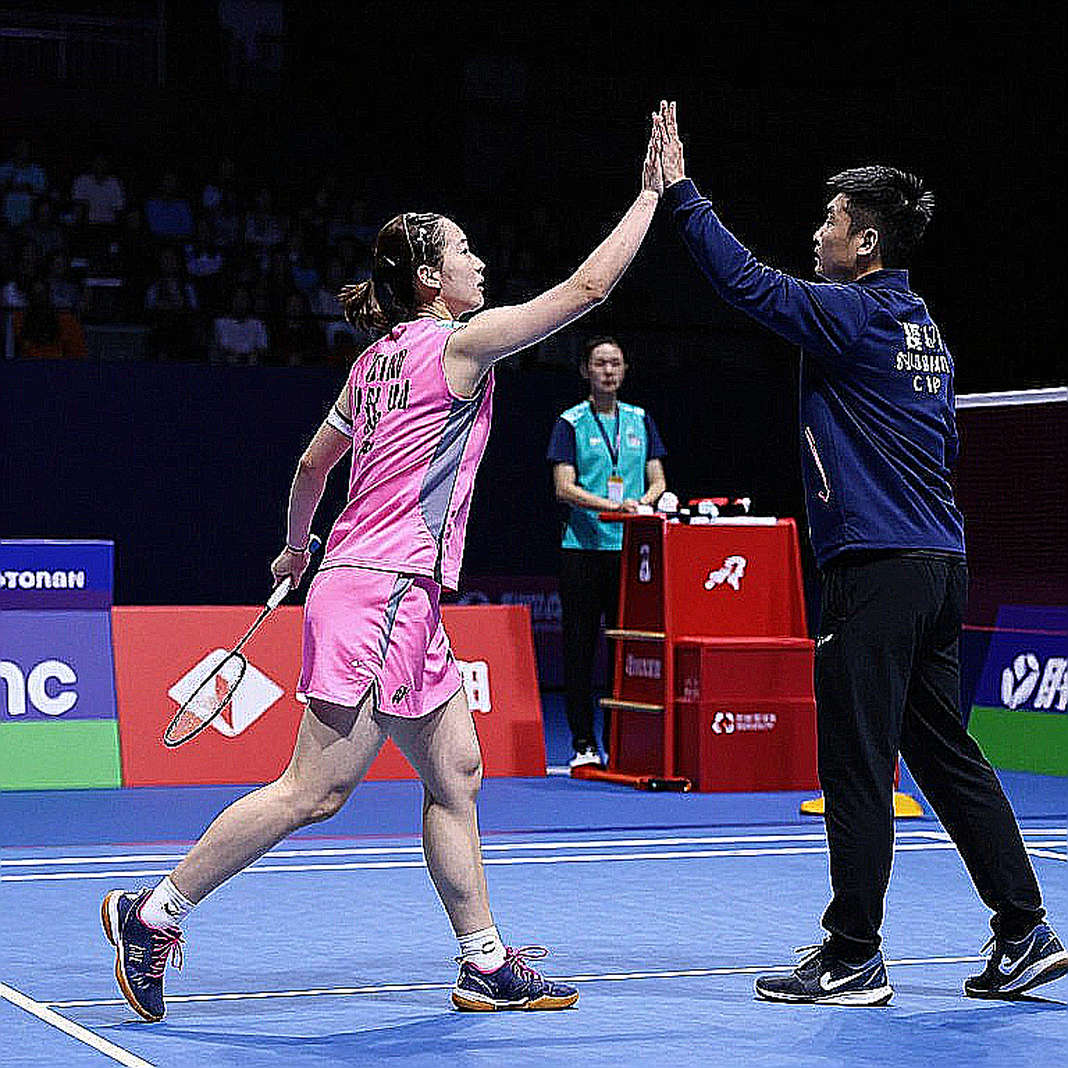
Prize money is only one income stream. For top Indian players, sponsorship and endorsements can be multiples larger. No public, verifiable figure for that impact exists in the available material.
7.3 Limits of comparison
When comparing with other Indian players' historical earnings, account for tier differences, year-on-year pool changes, and inflation and exchange-rate effects.
8. Claims pending verification
- Exact prize money figure — approximately US$31,500 is source-based; official BWF confirmation outstanding.
- Total prize pool size — derived from the 7.5 percent ratio, not directly confirmed.
- Identity of the final opponent — Christie appears as a comparison baseline, not clearly as the final opponent.
- Match-level technical data — smash speed, rally length and error rate unavailable.
- Tax-related claims — no specific rate or net income figure is verified.
- Rupee conversion — based on an assumed exchange rate.
9. Three technical conclusions
9.1 The scoreline is a control win. 21-17, 21-10 in 39 minutes indicates the match rhythm sat with Sen and the opponent had no effective means of breaking it. It is not a power win.
9.2 The real risk is the slow start. The 14-21 opening game against Koljonen, followed by 21-17 and 21-13, is more diagnostic than the final. It is an adaptation delay, not a physical ceiling.
9.3 Style alignment is the open question. Men's singles is trending faster, and control is a minority style. That does not make it weaker — it means it demands more precise preparation and faster adaptation.
10. What to watch next
10.1 Metrics for the next two to three tournaments
- First game: does the gap narrow across the first eight points?
- Three-game matches: is performance stable over longer matches?
- Power-attacking opponents: does control hold against faster players?
- Error rate: do unforced errors stay controlled despite deception reliance?
10.2 Questions only data can answer
- Was the 39-minute final a natural product of style, or a specific opponent weakness?
- Was the slow start a one-week event or a pattern?
- Is the long-match stamina question real?
11. Conclusion
The Hylo Open 2026 title is a significant addition to Sen's career. On prize money, the available material gives approximately US$31,500 in gross terms, consistent with a Super 500 distribution ratio but not independently verified — treat it as pending verification.
Technically, the final scoreline clearly signals a control-based win, while the quarter-final scoreline offers the more valuable diagnosis: the real improvement area is not physical capacity but the speed of early adaptation. That is good news, because it is a coachable area.
For readers who want only the number: approximately US$31,500 gross, pending verification. For readers who want the trajectory: the answer is more complex — and more interesting.